Viewing and Creating Custom Reports
Last updated: 15 Feb 2022
Learn how to navigate and manage the data in the Reports page.
On the Reports page in the Data section of your project, you can create and configure multiple summary reports with custom graphs, tables, and color schemes. The custom reports are shareable by either printing, saving as a PDF, or storing them on an external cloud service.
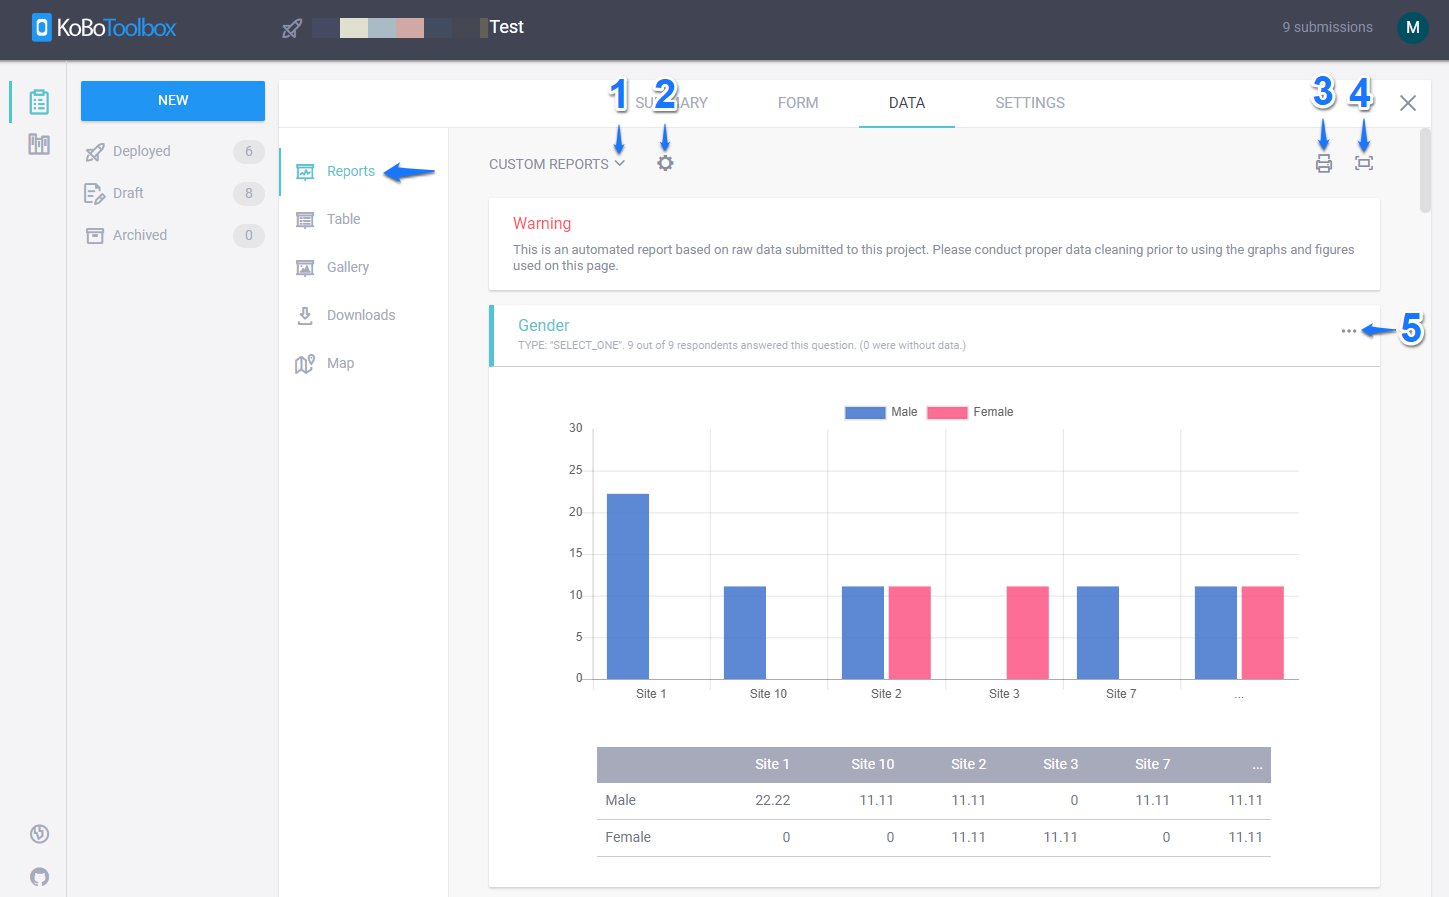
1. Custom Reports:
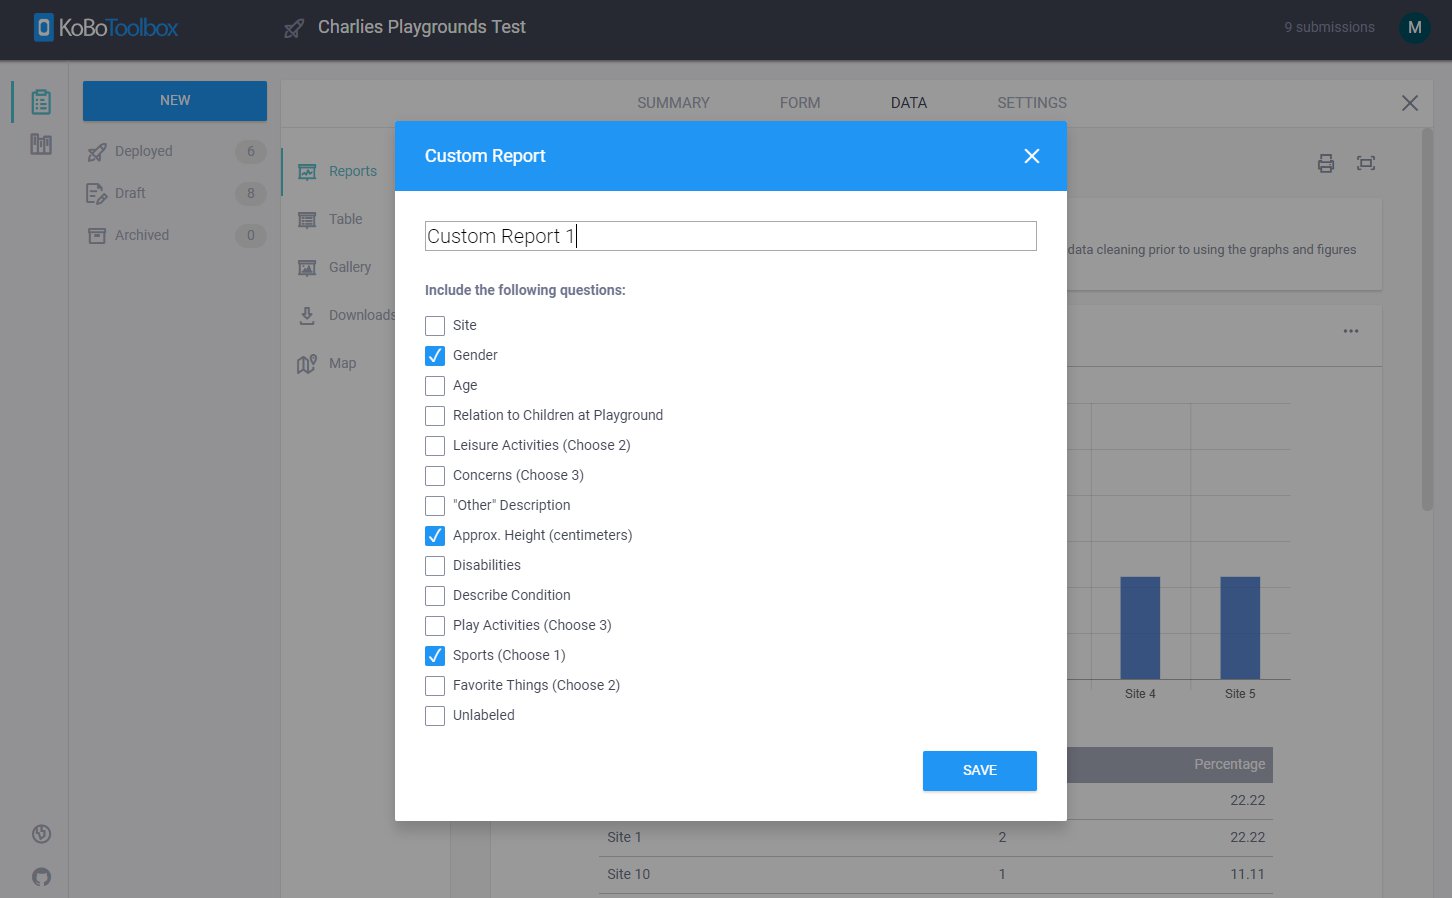
The CUSTOM REPORTS allow you to view the Default Report based on the dataset available in your survey project. It also allows you to Create New Report (by giving it a unique title and selecting which questions to include or exclude) or search through previously created custom reports.
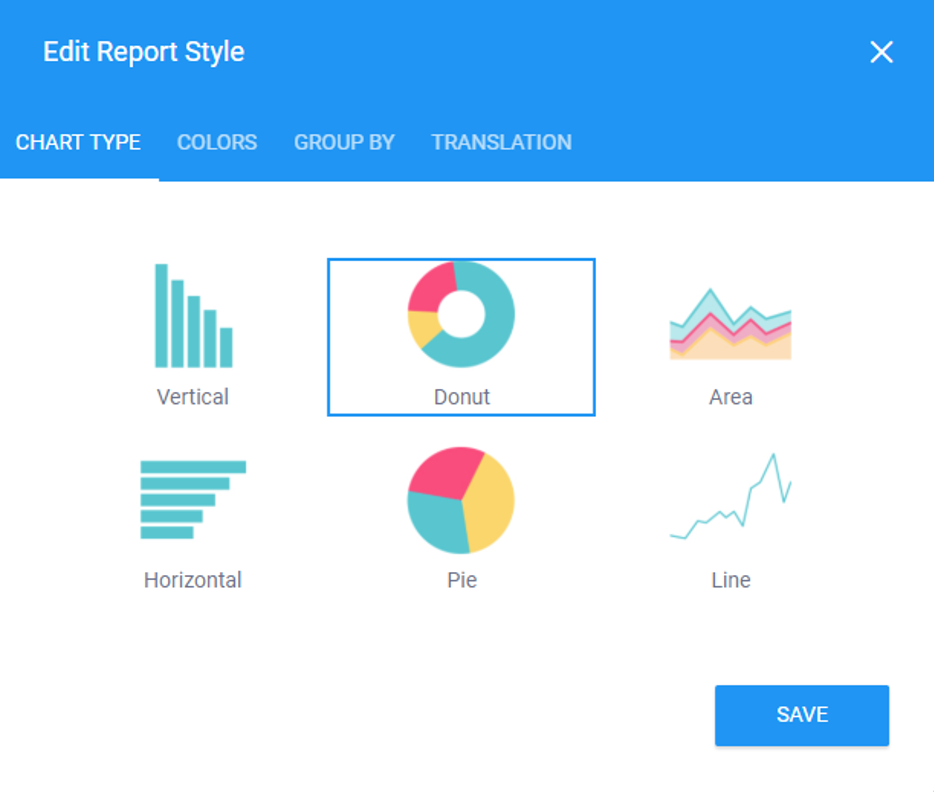
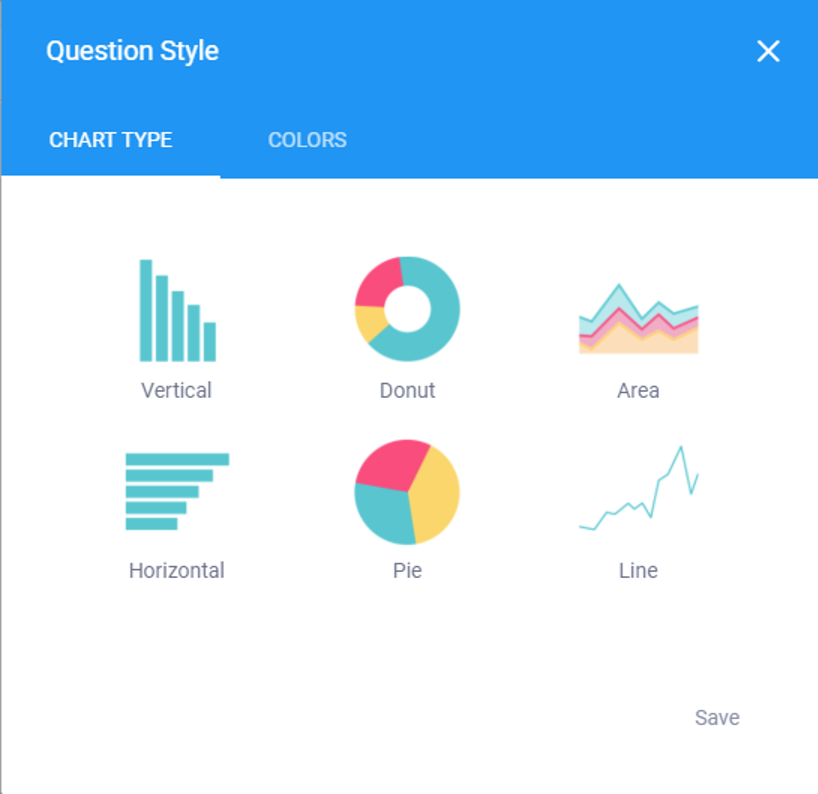
2. Edit Report Style:
The Edit Report Style button allows you to change the CHART TYPE to Vertical, Donut, Area, Horizontal, Pie and Line.
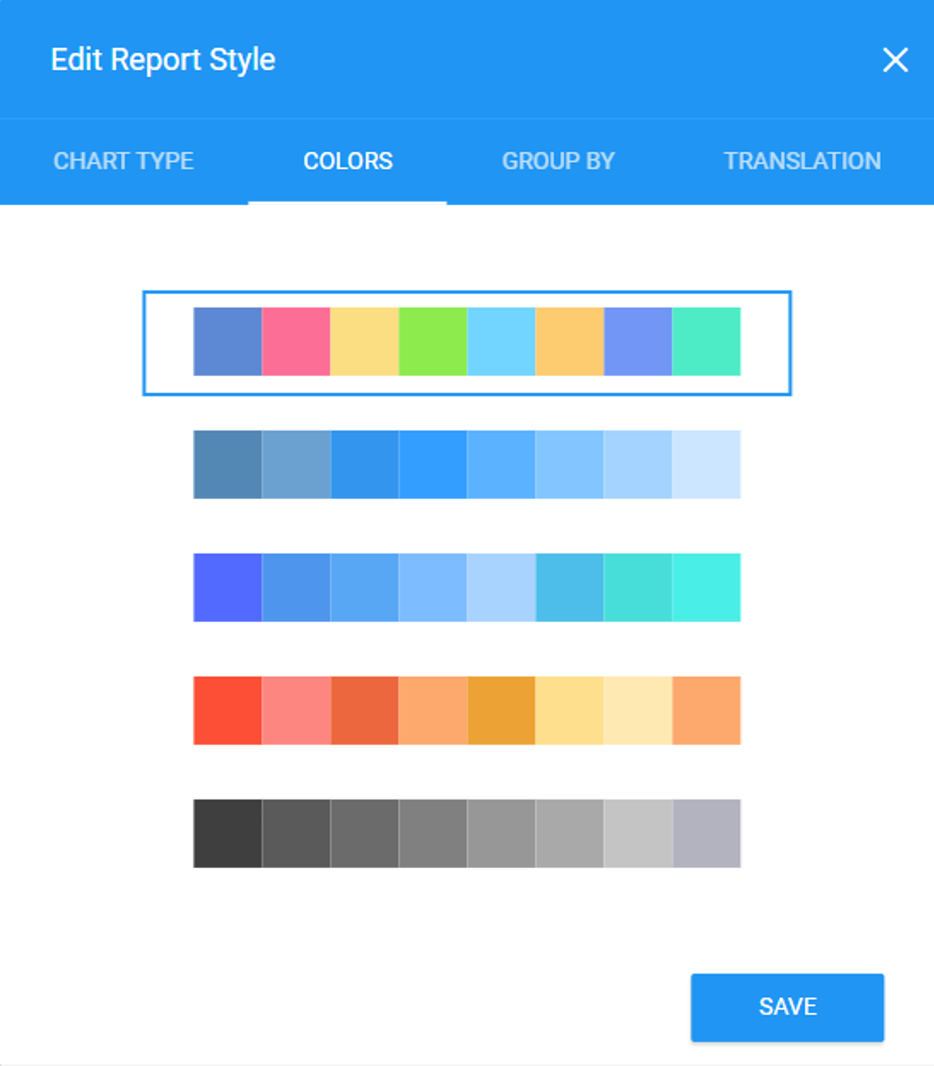
It also allows you to choose different COLORS for your charts.
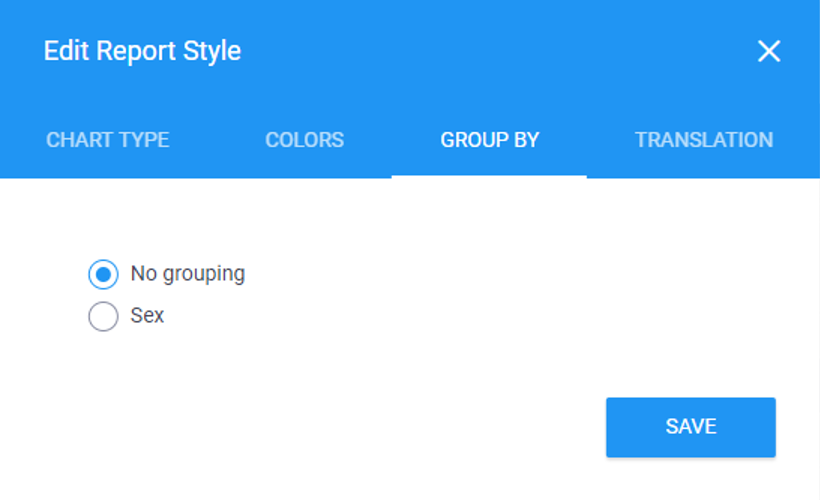
You can also group the charts by different categorical variables available in your dataset by selecting GROUP BY and selecting a variable from the provided list. Please note: If a variable has more than 5 choices, KoboToolbox would create a chart displaying only 5 choices lumping the rest together as …
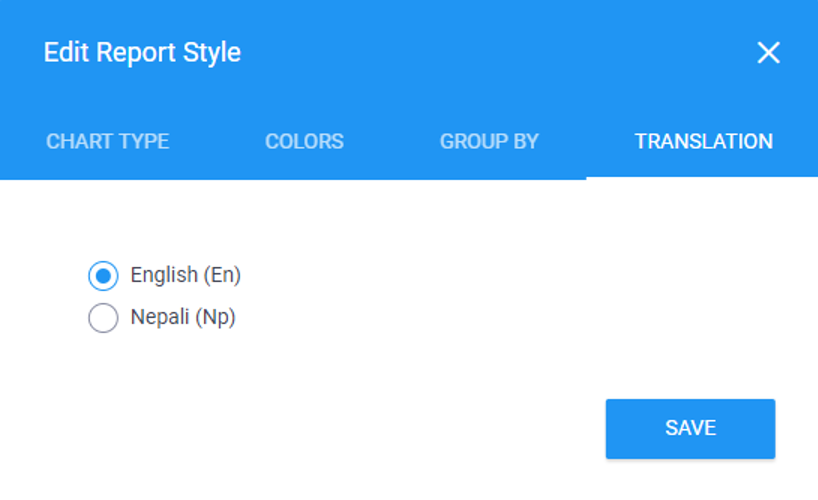
Or you could also change the label of your charts to different languages available on your survey project by selecting TRANSLATION. (This tab will only appear if you have multiple languages in your survey project)
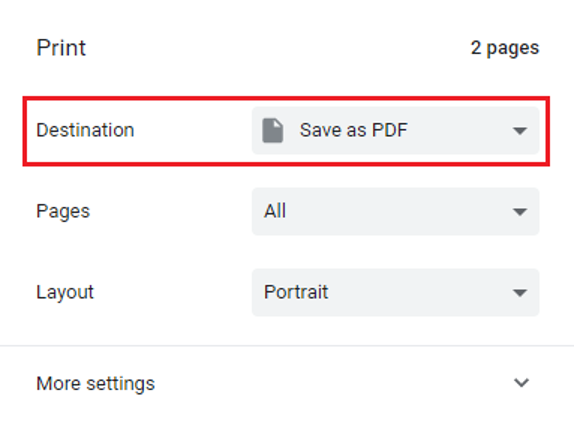
3. Print: You could also print the custom report by clicking the Print icon or save it as PDF by selecting Save as PDF under Destination.
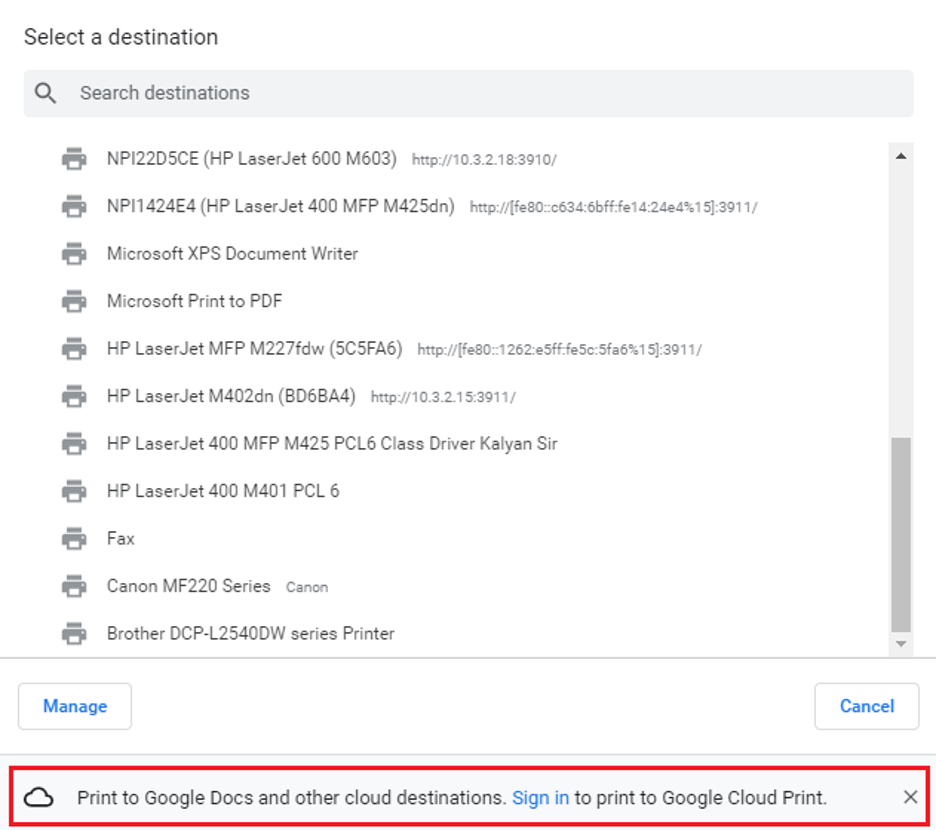
You could also store the same to an external cloud storage service like Google Drive.
4. Toggle full screen:
You could Press Toggle full screen to view the custom reports in a full screen or press back the Toggle full screen to view it to in a normal mode.
5. Override Graph Style:
You could click the Override Graph Style (3 dot icon) to customize the CHART TYPE and COLORS of the chart for each variables (questions) within your custom reports. This will override the graph style (for a question) that has been defined by Edit Report Style in your custom report that has been explained above.
If you have still issues exporting your data, please don’t hesitate to let us know in the Novo Ticket (elengeafrika.com).